How it is possible to identify website bottlenecks that affect loading speed?
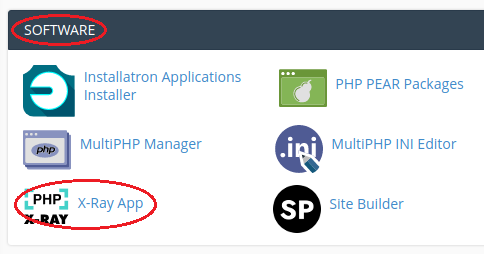
For analyzing a website there is a tool in the cPanel interface called X-Ray App, which makes analyzing very easy.
Open X-Ray App menu in the cPanel interface and click the “Start tracing” button to analyze a webpage:

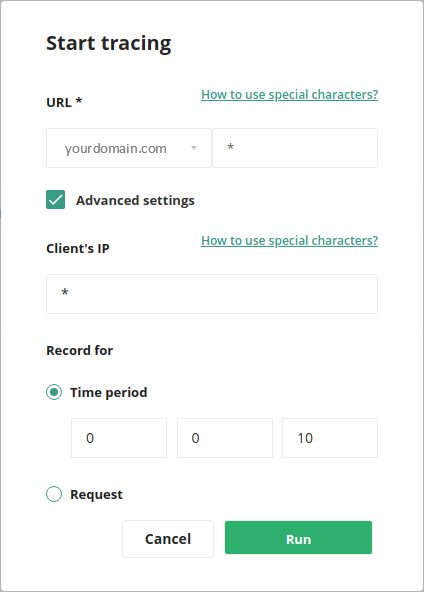
In the “Start tracing” window that opens, you can make the following options:
URL: from the drop-down menu select the domain in your account, which webpage you analyze
URL (field on the right): type “*” (without the quotation marks) in this field
Advanced settings: check this box for more detailed setup
Client’s IP: in this field you can enter the IP address from which incoming visits/queries were made, that will be will be analyzed
Time period: under this option you can select the period during which the web page will be analyzed (for example, enter 10 minutes)
Request: under this option, you can specify how many webpage queries are analyzed (the default is 20)
Under “How to use special characters?” links you can see more information on how to use different parameters to analyze the website.
When all selections have been made, press the “Run” button:

The X-Ray App will then start analyzing your website and the text “Running” will appear in the Tracing status column:
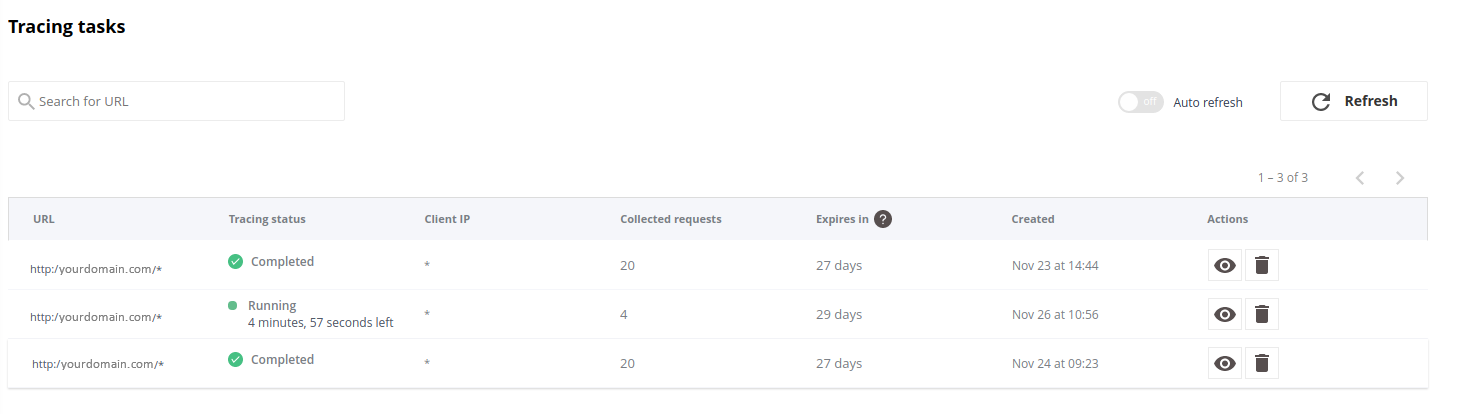
When the analysis is complete, the text “Completed” will be displayed in the Tracing status column.
At the top of the table is the “Auto refresh” button, which allows you to turn on the automatic refresh of the X-Ray App page, and when the analysis of the web page is complete, you will see it immediately.
Use the “Refresh” button to refresh the page manually.
Meanings of the columns in the table:
URL: address of the website analyzed
Tracing status: analysis status
Client IP: IP address of the website visitor
Collected requests: number of queries made to the website during the analysis
Expires in: number of days remaining until the report is deleted (reports will be retained for 30 days)
Created: time of report creation
Actions: actions you can choose on reports (eye icon: view report, trash can icon: delete report)
To view a report, click either on the webpage address of the report or on the button with the eye icon on the right.
The opened page displays information about the website queries made during the analysis:

On this page, you can see which queries took the longest time to open the webpage, and you can view more detailed information about those queries.
Clicking on the query line will show more detailed information about this query:


Top software modules/plugins by execution time – list of website add-ons/modules/plugins, sorted by their execution time
Top database queries by execution time – list of database queries sorted by query execution time
Other system functions – other system functions that were analysed
Use the “Download as PDF” button to download a report in PDF format for the selected query:

The X-Ray App is a truly valuable tool for website developers to determine which website components (add-ons/modules/plugins) have the greatest impact on website loading speed.
You can find tips for optimizing your WordPress website from HERE.
You can find tips for optimizing your Joomla website from HERE.